Investor ResourcesImproved Stoves: Usage Rates
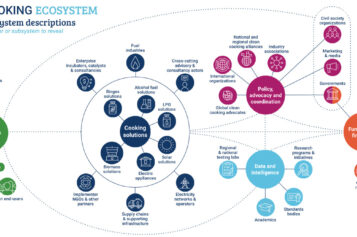
Overview
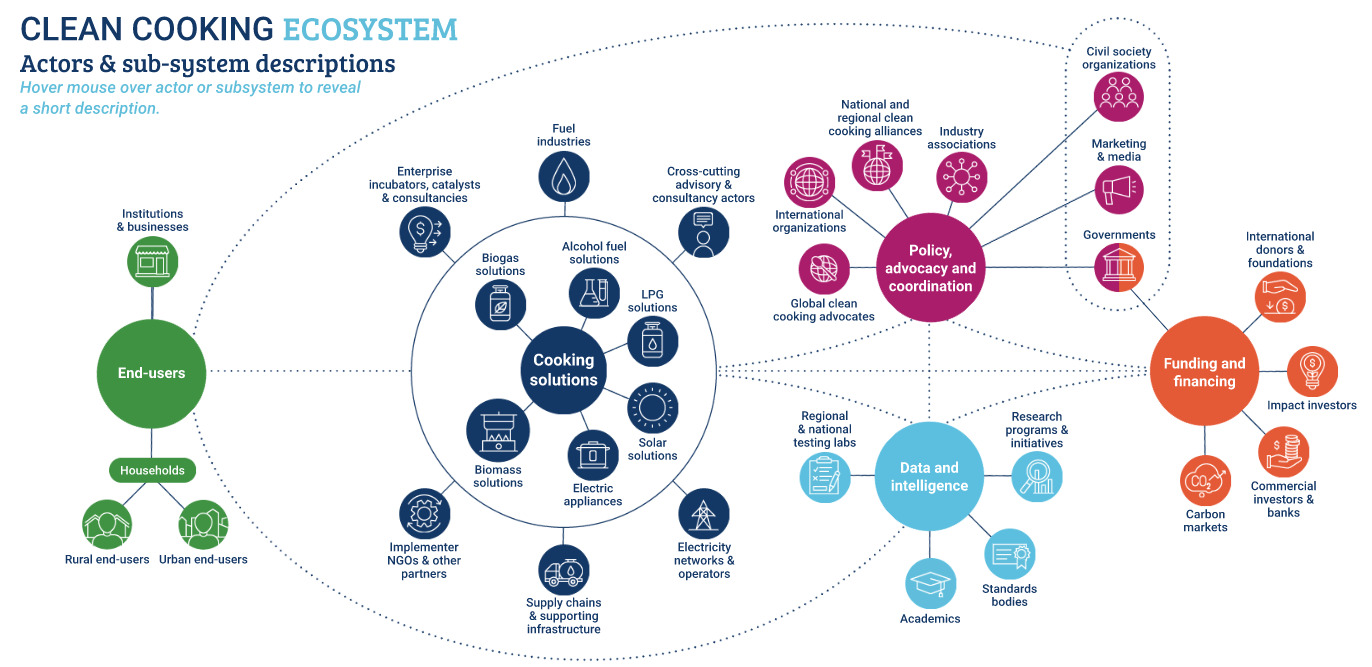
This section contains information on the latest investment and operational trends in clean cooking, including customer perceptions of clean cooking companies’ products and services. All data has been aggregated to protect the identity of the companies.
If you would like to know more about the underlying data CCA has available, please reach out to investment@cleancooking.org
Industry Snapshot Data
This section contains information on the latest investment and revenue trends in clean cooking. The selection of charts and commentary have been taken from the latest version of the Industry Snapshot. All data has been aggregated, so as to protect the identity of the companies.
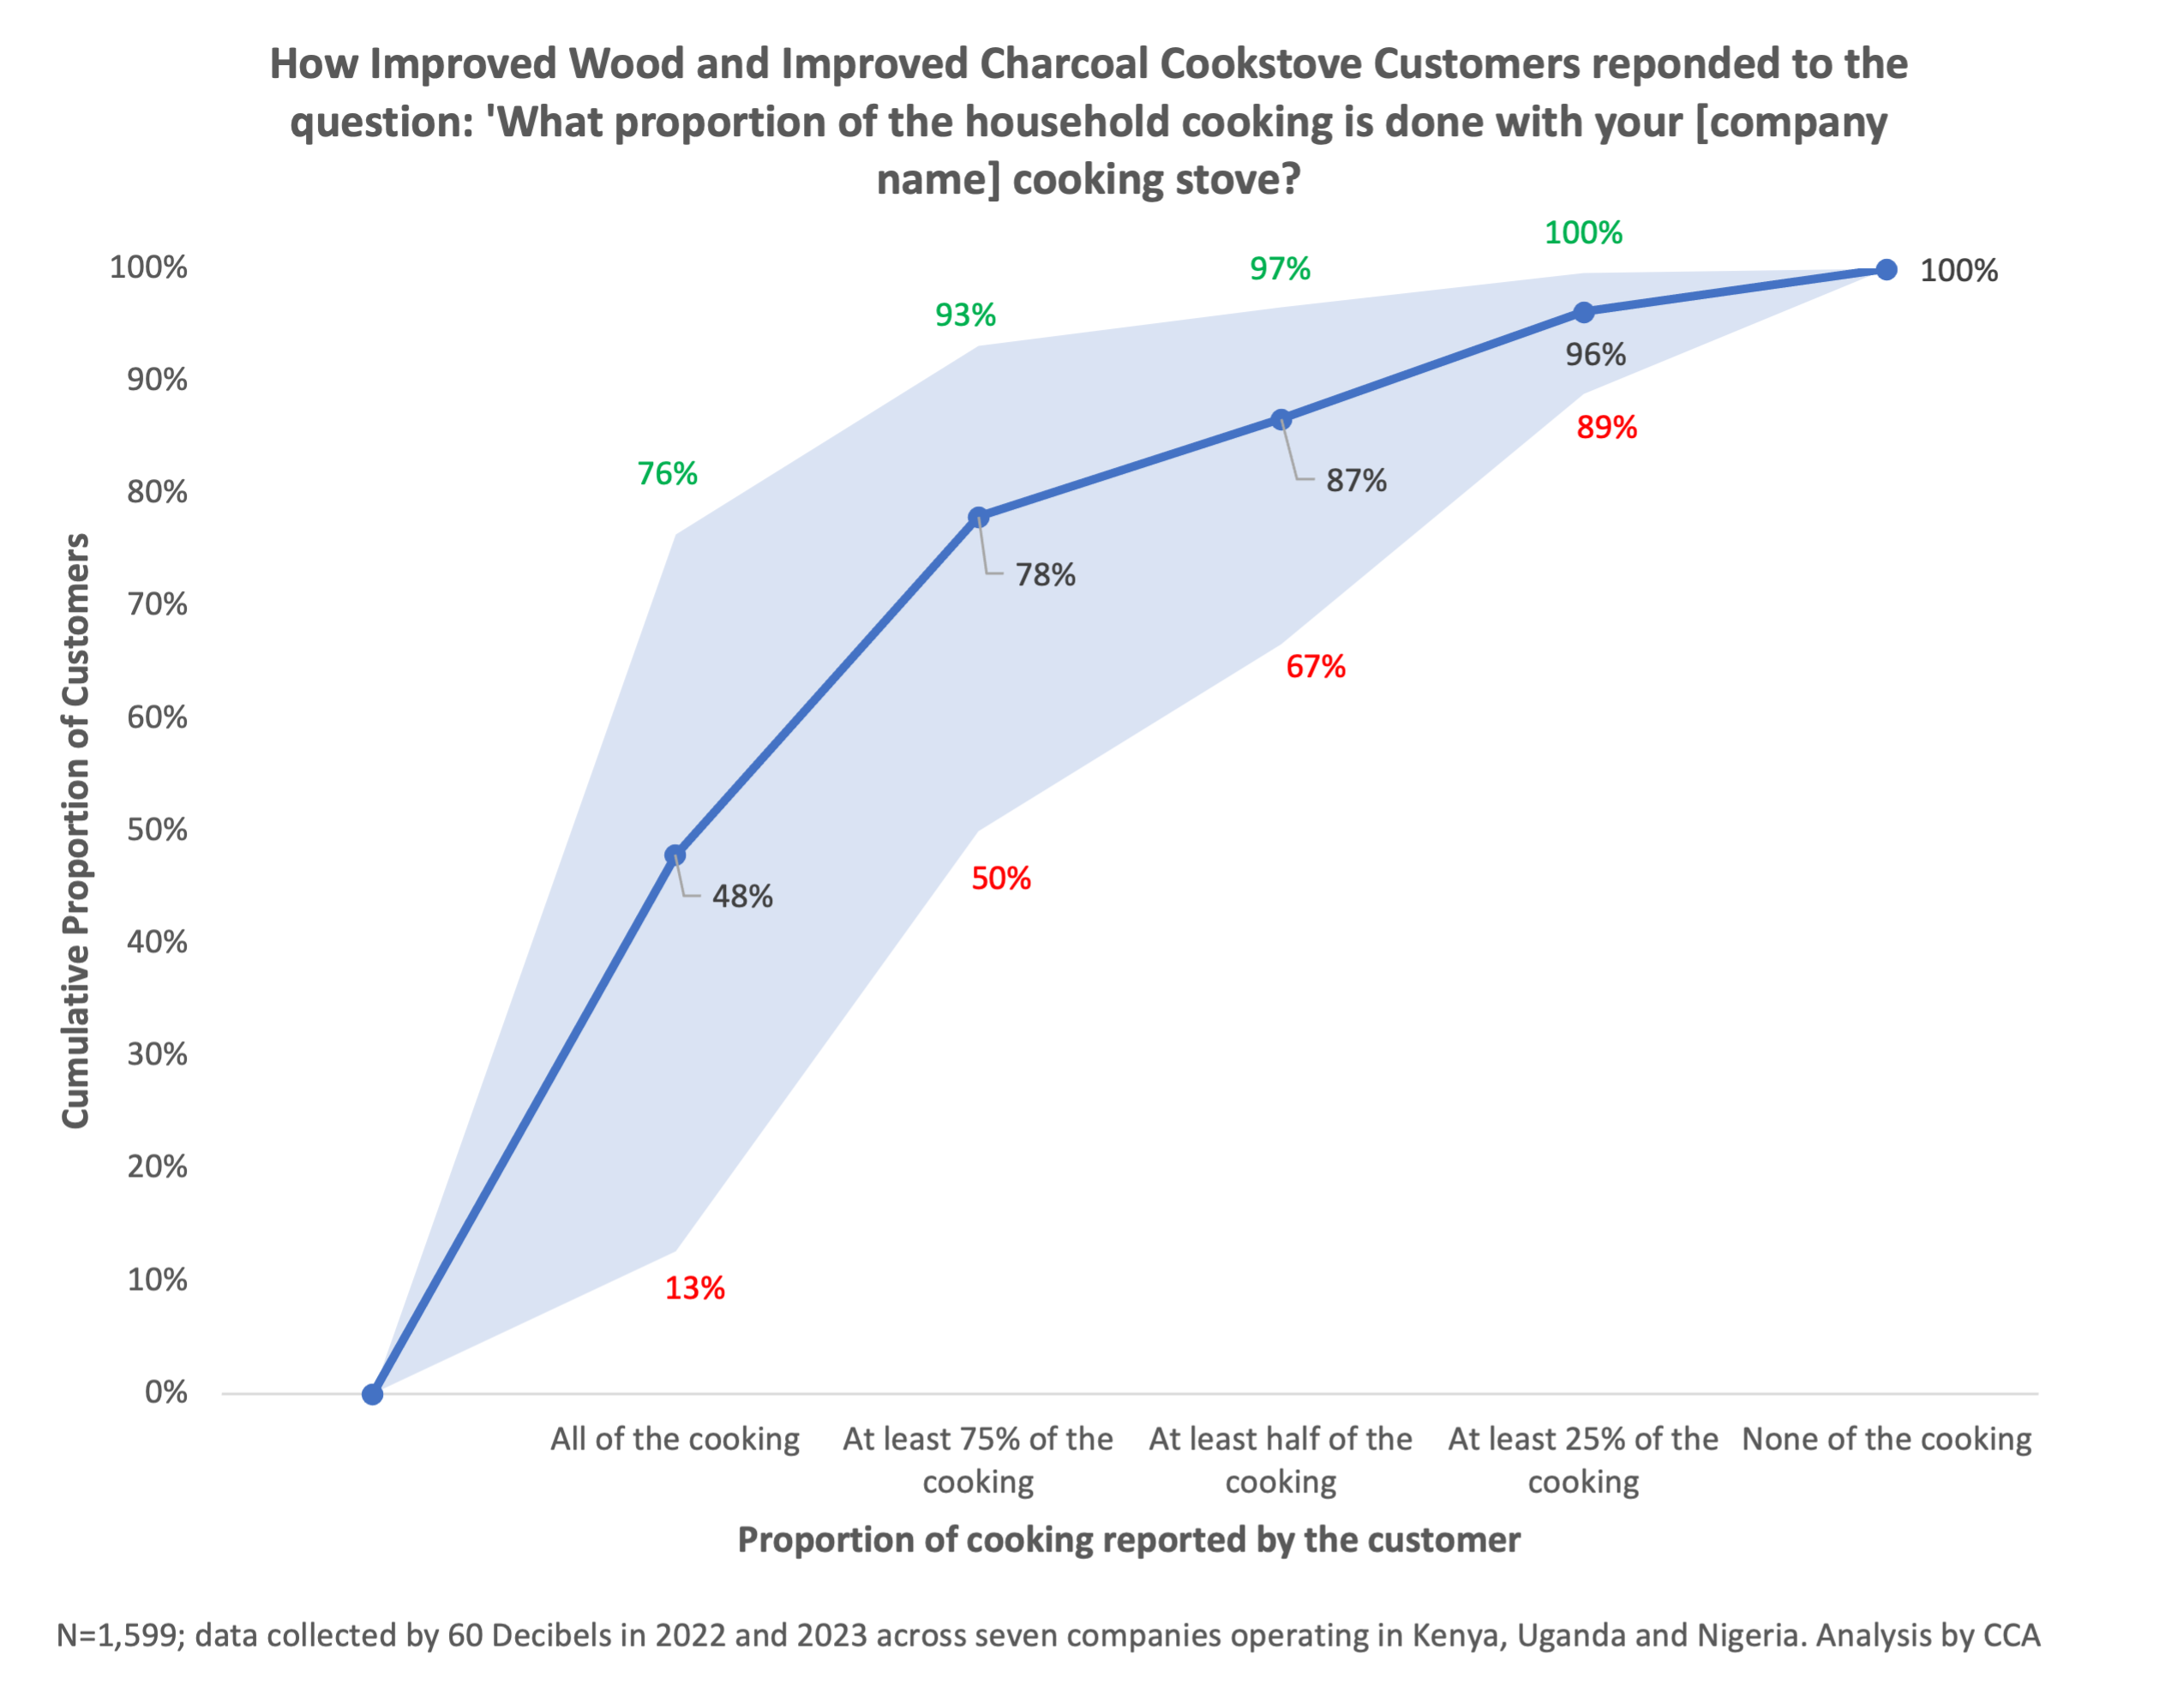
Clean Cooking Customer Benchmarking
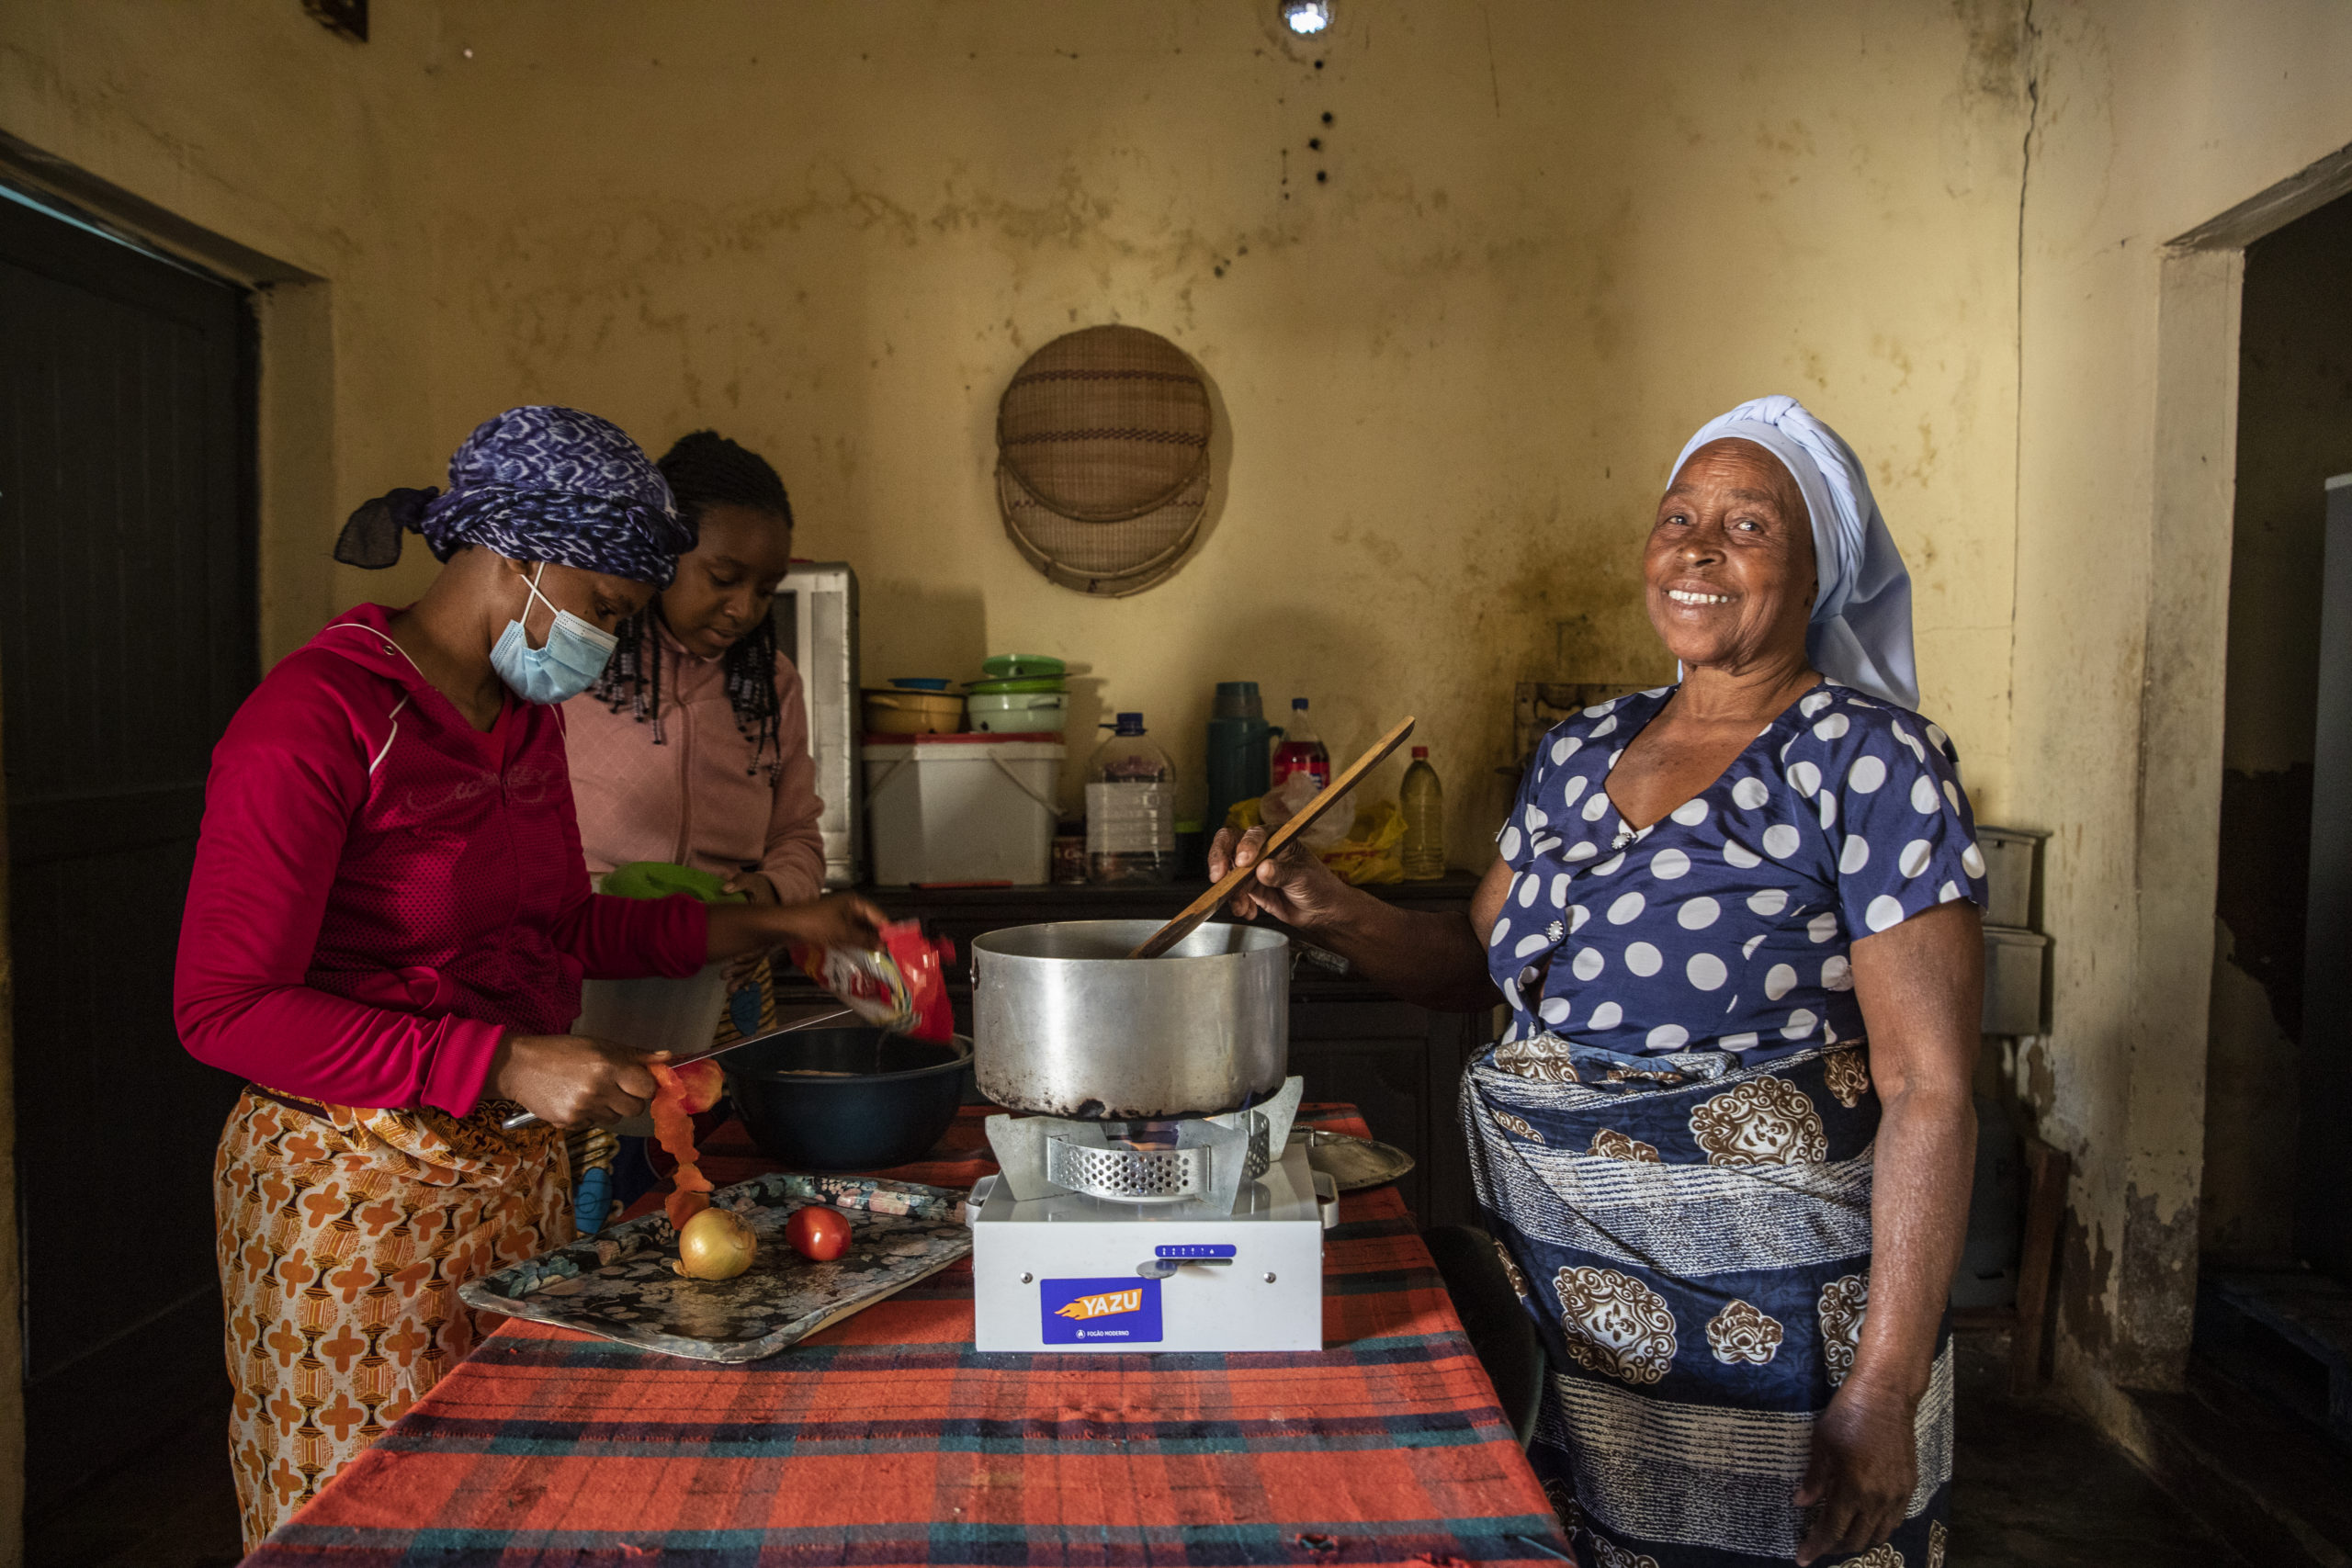
CCA partnered with 60 Decibels to interview more than 5,000 clean cooking customers between October 2021 and January 2024. Some of the aggregated findings and insights are displayed below.
Updated in 2023, the CCA Venture Catalyst’s Lean Data Insights Aggregate Report contains data from 18 CCA Venture Catalyst portfolio companies, working across 9 countries. The report is available here
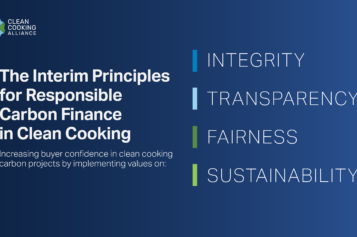
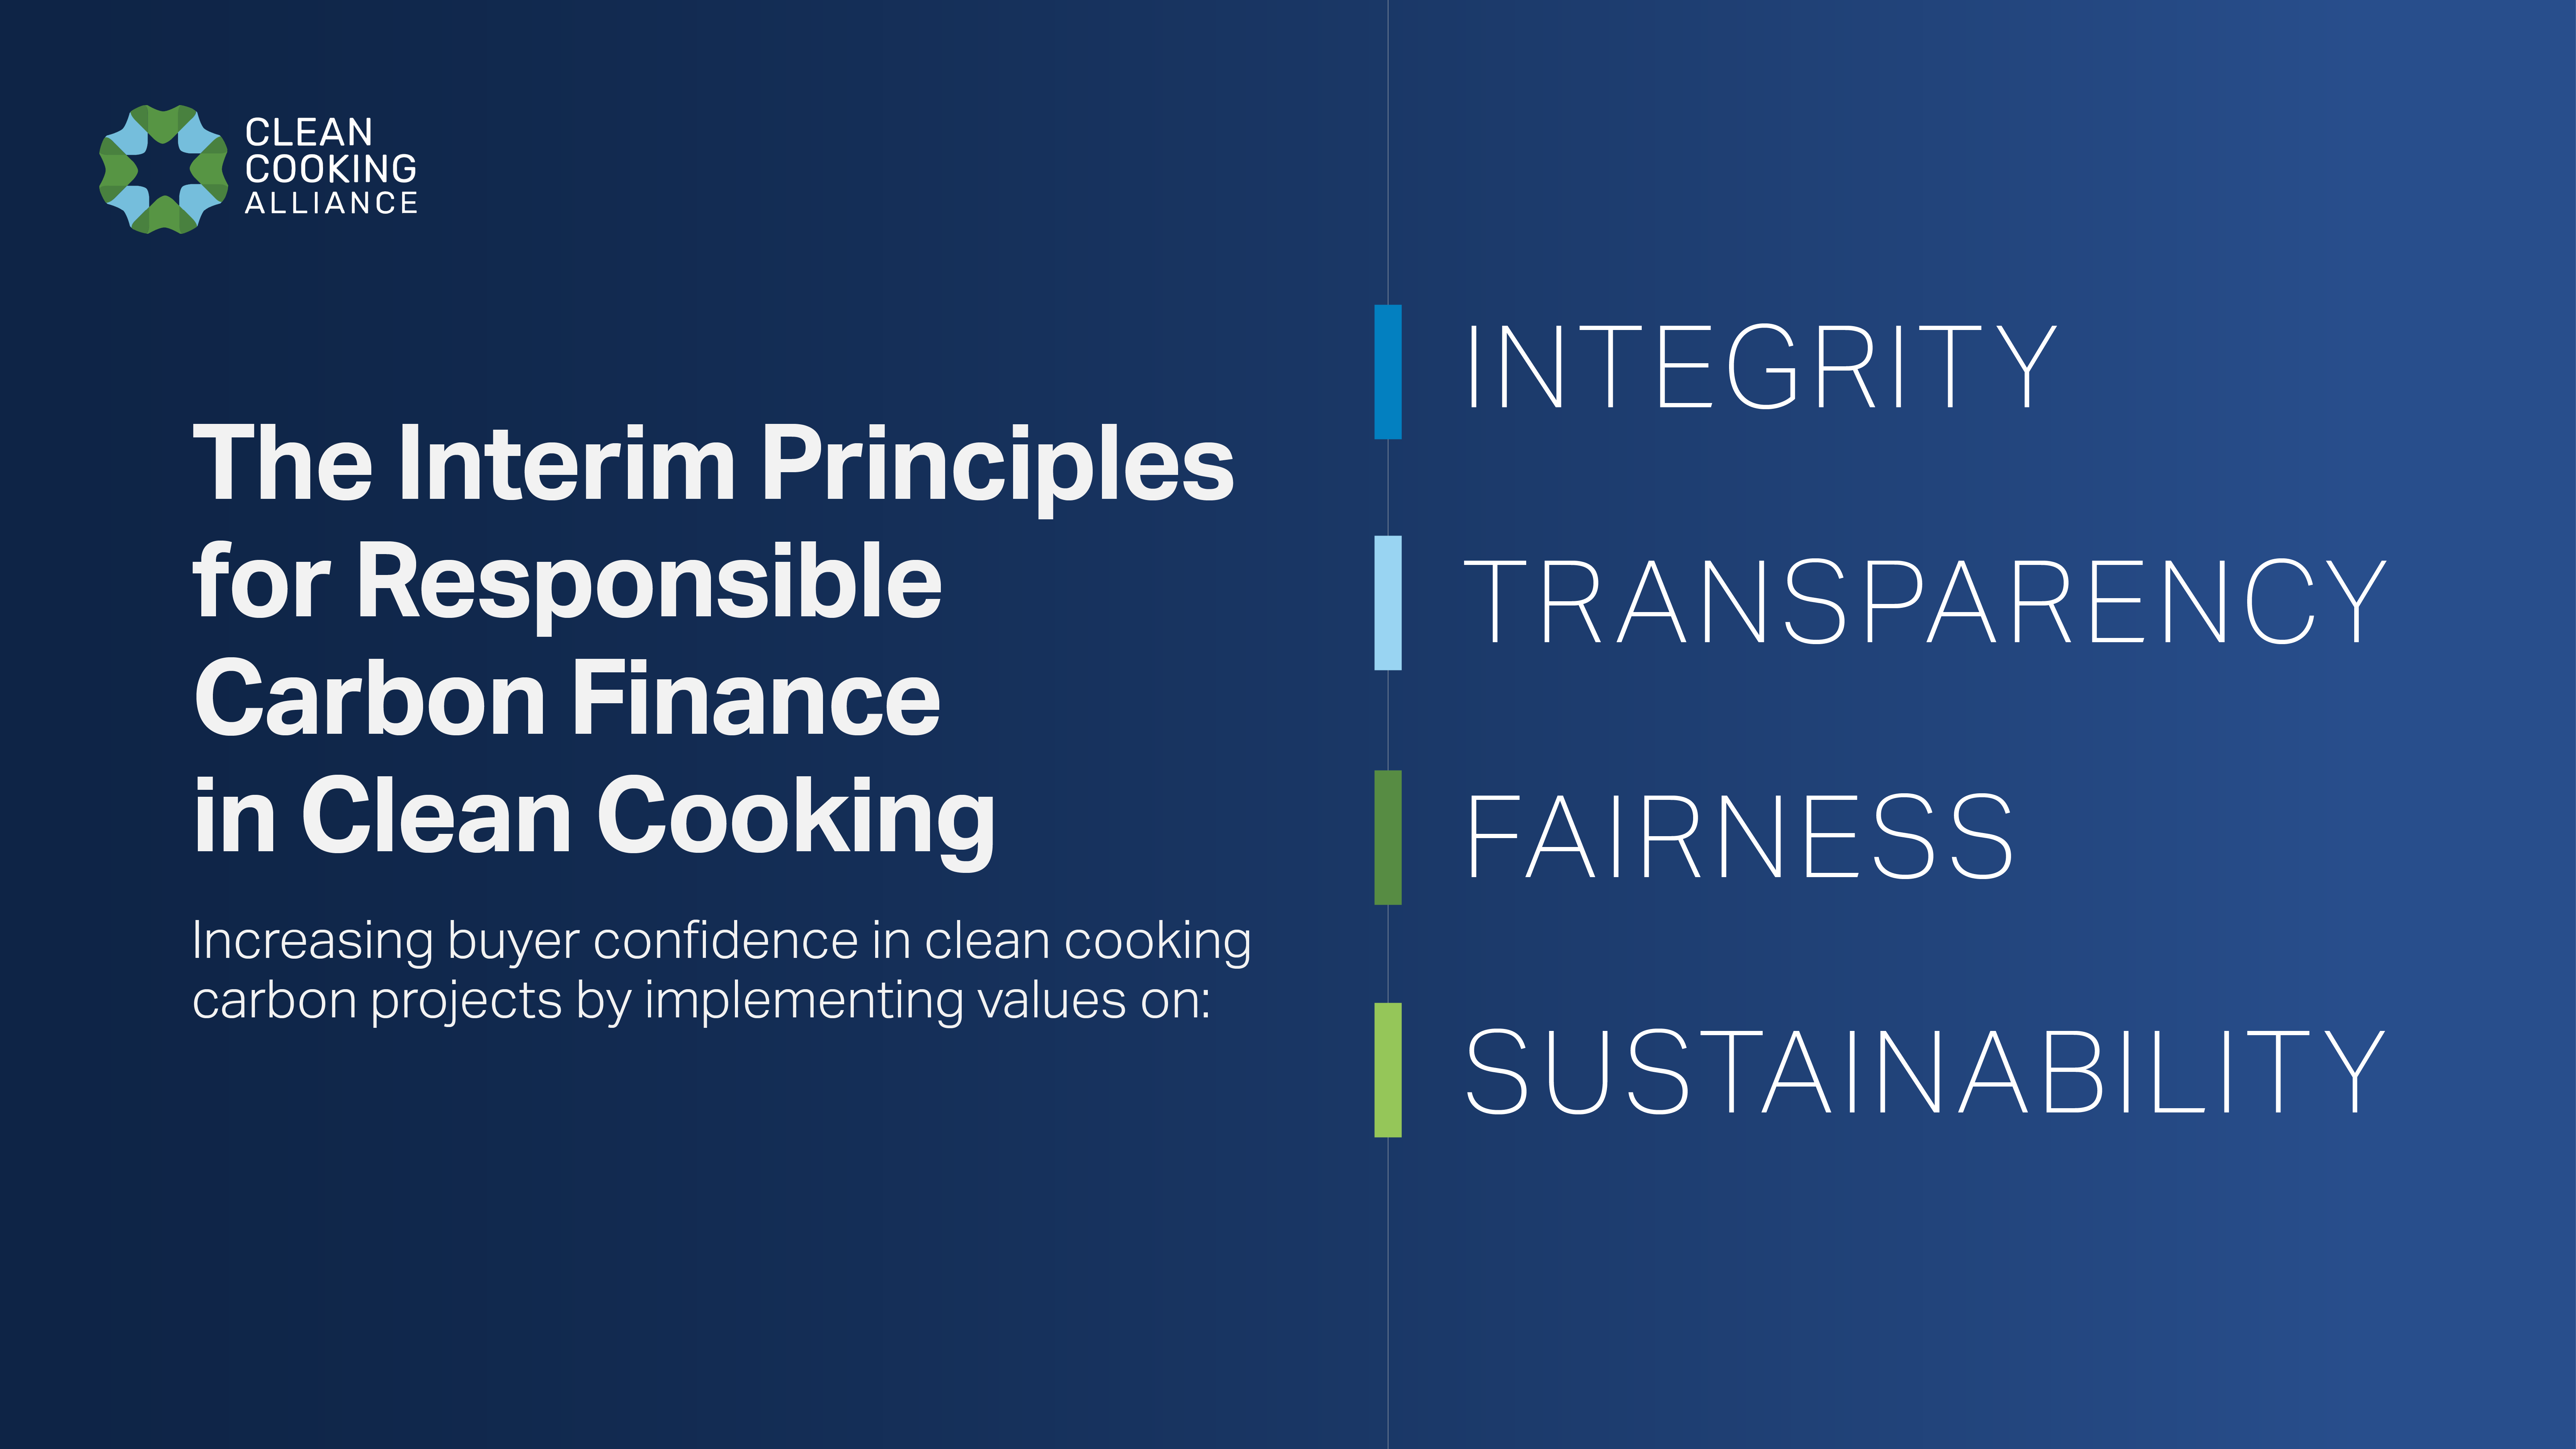
Carbon
As of January 2023, at least 1,075 cookstove projects have been registered. These projects have generated a combined total of 69.7 million carbon credits to date, which is approximately 4% of the total issuances seen on the Voluntary carbon market to date.
(Data source: Ivy S. So, Barbara K. Haya, Micah Elias. (2023, January). Voluntary Registry Offsets Database v7.1, Berkeley Carbon Trading Project, University of California, Berkeley. Analysis by CCA)
Clean Cooking RBF
Here is a table of all known Results Based Financing programs that involve clean cooking. If you would like to add to the table, please email us at investment@cleancooking.org
| Program Name | Status | Start Year | Final Year | Countries of Operation | Total RBF Size | Eligible Cooking Fuel Types | Implementing Organization | Scope |
| Energising Development (EnDeV) Result-Based Financing (RBF) for low carbon energy access | Completed | 2012 | 2020 | Bangladesh, Cambodia, Ethiopia, Kenya, Laos, Malawi, Nepal, Peru, Vietnam | $55m | Electricity, biomass, biogas | GIZ/EnDev | Energy, including cooking |
| Carbon Initiative for Development (Ci-Dev) | Implementation | 2014 | 2025 | Rwanda, Madagascar, Laos, Burkina Faso, Ethiopia | $76m | Biomass, Ethanol, biogas | The CiDev Trust Fund is managed by the World Bank | Energy, including cooking |
| Clean Cooking Fund (CCF) | Implementation | 2020 | Ongoing | Africa, South Asia, Rwanda | $500m | All | ESMAP | Just cooking |
| Renewable Energy and Climate Technologies (REACT) RBF Programme | Implementation | 2021 | 2023 | Kenya | $4m | biomass, ethanol, LPG, Biogas | AECF | Energy, including cooking |
| Kenya Off-Grid Solar Access Project (KOSAP) RBF and Debt Facility | Implementation | 2018 | 2023 | Kenya | $5m | Biomass Technologies, LPG, Ethanol, Biogas, Electric Cooking | SNV/SunFunder | Energy, including cooking |
| BRILHO Mozambique | Implementation | 2019 | 2024 | Mozambique | $40m | wood, charcoal, pellets, briquettes, biogas, LPG, ethanol | SNV | Energy, including cooking |
| East Asia and Pacific (EAP) Clean Stove Initative (CSI) | Implementation | 2012 | 2025 | Indonesia, China, Laos, Mongolia | $137m | Biomass | World Bank and country ministries | Just cooking |
| Universal Energy Facility (UEF) | In design | 2020 | Ongoing | Africa | $500m | All | SEForAll | Energy, including cooking |
| Beyond the Grid Africa (BGFA) | Implementation | 2019 | 2028 | Burkina Faso, Liberia, Zambia, Mozambique, Uganda, Democratic Republic of the Congo | $108m | All | Nefco; REEEP | Energy, including cooking |
| Clean & Cook Impact Bond | In design | Unknown | Unknown | Kenya | $0.5m | All | Cardano Development (incubated by Frontier Finance Solutions) | Just cooking |
| Impact Buying Facility | In design | Unknown | Unknown | Unknown | $9m | All | Cardano Development (incubated by Frontier Finance Solutions) | Just cooking |
| Netherlands Enterprise Agency (RVO) SDG 7 RBF Facilities | Implementation | 2019 | 2026 | Bangladesh, Burkina Faso, Chad, Ethiopia, Gambia, India, Kenya, Mali, Mozambique, Niger, Nigeria, Uganda, Rwanda, Senegal, Sudan, Tanzania, South Sudan | $24.4m | All | RVO | Energy, including cooking |
| Modern Cooking Facility for Africa (MCFA) | Implementation | 2022 | 2027 | Democratic Republic of the Congo, Kenya, Mozambique, Tanzania, Zambia | $30.5m | Electric, biogas, briquettes, pellets, bioethanol | Nefco | Just cooking |
Custom Insights
Back to Investor Resources
